Guest essay by Larry Hamlin
The EPA has deleted (this chart and data no longer exist at the EPA website) its prior indicator climate data trend chart showing “unusually hot and cold temperatures” across the U.S. and showing the U.S. Heat Wave Index from 1895 to 2015 (shown below) that clearly established the unique drought and heat period of the 1930s.

This long-standing climate data chart has now been replaced by a chart which simply “disappears” any notion of the great drought and heat wave period of the 1930s as shown below.
EPA have also added another chart of “Heat Waves” climate data that does not even contain the 1930s period as shown below which starts in the decade of the 1960s.

The chart of U.S. droughts remains the same but given the changes to date in the other charts and their data this charts remaining time is probably short lived.

It appears that we have entered the Soviet Era of “disappearing” charts and data but now under the era of the “Biden climate science purge.”
Eisenhower warned about Science Elites control science….
True statement
He also warned about the military-industrial complex. We didn’t heed that, either.
And McCarthy warned us about the insidious progress of single/central/monopolistic/leftist regimes speaking truth to facts (e.g .conflation of logical domains) in lieu of science philosophy and practice of observation, replication, and deduction in a limited frame of reference, and forcing people… persons denying the consensus to take a knee or be cancelled.
George Orwell lives! But he did not intend “1984” to be an instruction manual.
He observed techniques already practiced in his time. The current cabal are just following their mentors.
“He who controls the past controls the future. He who controls the present controls the past”.
“The mass of the people will more likely believe a really big lie than a small one!” A. Hitler in Mein Kampf!!! The essence being that if it sounds really fantastic as to be almost unbelievable it must be true!!!
Hitler said the ‘collosal lie’ spread by the Jews that Ludendorff, the facto German army commander was the cause of the loss of the war.
Hitler took advantage of something that people wanted to believe, that Germany was unbeatable.
German propaganda and the fact that the war was fought in France and Belgium made it easy to believe that Germany was not losing the war. This belief in direct contradiction with the war reparations, territorial losses, and perceived humiliations provided the background to the rise of Adolf Hitler.
Thankfully you have copies along with Tony heller. Its disgusting the lengths these people will go to too eliminate the truth.
Ditto. Tony periodically produces excellent videos exposing data manipulation and data fraud by NASA and others. Here is one … https://www.youtube.com/watch?v=D73i74Z2yk4
Cheers J.
Amen, Tony is a Hero for his work, and one helluva photographer. Not to take away from the the good work here and on other sites but Tony’s was the first I found, he gave me hope that the world hadn’t gone over the deep end.
I do not subscribe to many but Tony is near the top. He very much hated by the climate alarmists, which means he is over the target. He posts on YouTube, NewTube, Rumble, GAB, etc.
Yes, some of us found the heat wave chart before it was removed.
https://wattsupwiththat.com/2019/09/06/the-gestalt-of-heat-waves/
Good article Clyde.
Thank you.
Clyde Spencer
As reported by Climate believer somewhere below, the chart was never removed.
It was simply put elsewhere, that’s all:
But… like Climate believer, I did not appreciate at all the other heat wave chart placed in front of this one, which ‘carefully omits’ the data before the 1960’s:
https://www.epa.gov/climate-indicators/climate-change-indicators-heat-waves
That is not the right way to inform…
J.-P. D.
P.S. It’s a bit late right now at UTC+2, and I’ll come back later on to this place, with another chart, based on John Christy’s latest evaluation of daily maxima / minima in CONUS.
Anthony, I think a variation of surfacestations is needed – to preserve state climate records from this period. Remember the blue governors would do Joe’s bidding and purge these records in a minute.
Agreed Gary,Maybe Larry or someone else at WUWT Could take some time off to record this information.
Mr. Clarke: Your comment reminded me of the stories in Dec. ’16 about how folks at agencies were furiously backing up data before Trump could delete science. How ironic that they were so righteously concerned to save this info so they could delete it now.
And exactly what data did need backing up? And what science did trump want to delete?
I only read about it, but the Obama folks may have told it to the news reporters that way, and the reporters were ever so grateful to have Obama admin folks hand stories to them before deadlines.
Does anyone have a list of all the sources?
modern “science” = disregard the actual observations, create new ones from thin air and blame humans!
The Modern Scientific Method’
Actually, the technique is not modern only the “scientists” have changed. Former rulers used the Church and their clergy to reach consensus in order to get the peasants to give up their property and liberty. It was the priests of yore who provided the scientific credence of the king’s right to rule by divine providence.
Give it a rest. It’s not a coincidence that reason and classical liberalism originated in the Christian West. And it’s not a coincidence that the current rise of irrationality and progressive statism is now underway in the post-Christain West.
Modern Science is the art and handmade tale of plausible and politically congruent (PC). So, take a knee, beg, and/or be canceled. There are diverse precedents.
The lies from from government is increasing speed in many areas.
Could you fix my account so I can edit my posts if need be .thanks
You should be able to see the edit button at the bottom right corner, move the mouse arrow over the area.
Can you remember the rampant hysteria that gripped the Dem supporters when Trump won, terrified that he would ‘disappear’ their cherished Science? I think they have been projecting – maybe fears, maybe guilt but definitely something wholly theirs.
Mr. Page: We agree, please see me above.
So what was the drought that John Steinbeck was writing about in The Grapes of Wrath, or maybe the novel was just science-fiction?
Facebook fact checkers would rate it “mostly false”.
They’ll either declare that book as unbelievable total fiction or just burn it. Maybe do both.
Or declare it ‘Hate Speech.’
My vote is for evidence unbecoming for reason of Jew… White privilege. That said, you’re in denial. Off with your head, and your little baby, too.
The PBS station had a programme about the Dust Bowl with filmed evidence of the drought.
The dust storms were frightening in their intensity, and apparently some dust from the storms reached Washington DC. Then the legislators had to admit that there was a problem.
Have to remember, the “Dust Bowl” did have one redeeming feature. A bunch of ‘Okies’ moved to California. Raised the average IQ of both states.
But it is all for the greater good and the ends justify the means.
Who’s great good is that then? 😉 The One world Global Guvment, owning all the World’s resources metering them out as they see fit?
It was sarcasm.
Biden’s administration is as corrupt as the Big Guy himself. In the past two weeks they disappeared more than half of the US forest fire record. Now they have erased the heatwave/dustbowl 1930’s that Steinbeck wrote about in Grapes of Wrath.
Google UK tried to disappear Viner’s infamous 2000 remark about UK children not knowing snow. Didn’t work; Wayback retrieves the original Independent article containing his comment.
What ‘they’ forget is that ‘we’ remember. And that stuff on the internet is generally there forever. Not just on the Wayback machine, but because also archived on so many individual devices. And in my case, that large treasure trove of past information and ‘official misinformation’ is itself automatically backed up onto a one terabyte stand alone hard drive by Time Machine.
Who is in charge of the Wayback Machine?
Is it safe from manipulation by activists?
Is the Wayback Machine safe? I would say, probably not. There is too much uncomfortable history there to be safe from the 21st Century Book-Burners.
PaulH you ask a valuable question.
As I understand it from a casual encounter with an academic from Carnegie Mellon University, it started as a project at CMU to capture the content of the entire internet, daily. At the time it was very ambitious due to data storage limitations. In those days there were about 6-7 billion distinct web pages.
It was probably a military intelligence contract. The result was something you could access and detect changes in news and content including deletions and edits Using an original capture plus the metadata of changes only, there is no need to store the entire internet per day, but the database can recreate any page on any day.
I was quite surprised later to find the WayBackMachine being accessible to the general public – not all of it of course. Like GPS or Google maps or Intel processors, there are public and military versions of everything.
Addressing the heart of your question, the answer is that it is not so much that there is an “original” or “edited” version of a page in the WBM. What the manipulators of data and web searches do is provide a customized version of the search results that is personalized to you, just you. So if we all look at the past we may get different answers, tuned to where our thinking is “supposed to be”. Corrupted web searches have been standard fare for a couple of decades. That is how radicals are created, or misdirected, or countered. What then, is needed to create our own pasts? Read between these lines The electronic past is very amenable to change.
The only solution to the corruption of the public record is for people to develop a skill for the independent investigation of truth – a core element of a good education – so as not to become a plaything of the ignorant.
You’ll need the Way Wayback Machine?
Dunno. I maintain my own archive concerning all three ebooks. The Viner quote even got a linked footnote in my Blowing Smoke essay citing it. Since the ebook published in late 2014, both the quote and the link are indelible. Even if warmunists disappear the then viable link. The redundant original internet design has a certain beauty.
Don’t be surprised if the Wayback Machine doesn’t get the Fahrenheit 451 treatment. Servers and hard drives cannot survive an “accidental” fire.
“Now they have erased the heatwave/dustbowl 1930’s”

This is all nuts. The EPA has not erased this graph. The page is here. If you look down below the Figure 1 that is showing, you see this row of icons
And, sure enough, if you click on Figure 3, you see the page as featured above.
What was emphasized was the shorter period. Propaganda, not information.
I clicked on the link Nick provided, it is still there.
Both charts are there, nothing has been erased, you can see for yourself here by clicking on the link to the website page that show links to both existing charts.
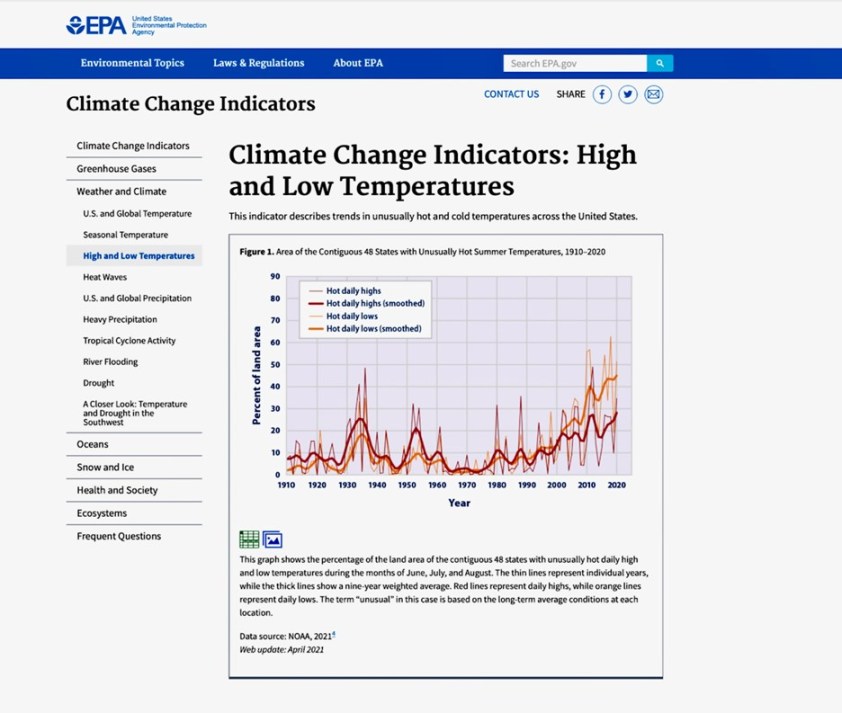
Figure 1. Area of the Contiguous 48 States with Unusually Hot Summer Temperatures, 1910–2020
===
Figure 3. U.S. Annual Heat Wave Index, 1895–2020
Click on the third chart.
Please read what is presented and what is omitted by the EPA. The discussion and emphasis is on periods beginning in 1970, 1980 and 1990. The placement, prominence and discussion of the graphs has been shifted. They are disappearing the warmer and drier early 20th Century.
READ! This is propaganda, not government-supplied information to its citizens. Nick (and others) use distraction to divert us from the central issue: UN IPCC climate models are bunk and our government, politicians, NGOs, CliSciFi practitioners and activists are engaged in a coordinated socialist propaganda campaign. READ!
Why can’t you post the omissions?
The guest blogger claimed that a chart was “disappeared” from the website, that was incorrect, here is the title of the post:
EPA “Disappears” the 1930s Drought and Heat Wave Climate Data
Data Sources
Figures 1 and 2 are adapted from an analysis by Habeeb et al. (2015).11 They are based on temperature and humidity measurements from weather stations managed by NOAA’s National Weather Service. NOAA calculates daily apparent temperatures for metropolitan areas and publishes the results at: http://www.ncdc.noaa.gov/societal-impacts/heat-stress/data. Figure 3 is based on measurements from weather stations in the National Weather Service Cooperative Observer Network. The data are available online at: http://www.ncdc.noaa.gov. Components of this indicator can also be found at: http://www.globalchange.gov/indicators.
But the chart and the data is still there and easy top find at the website.
Figure 3 data source is for that chart that never vanished at all.
I wonder what omissions you are talking about?
I speak for myself, not the author. I say that the writeup and chart placements reflect an attempt to sell, not inform. The writeup emphasizes the last few decades, not the full record. Only later in the writeup do we see a brief mention of the 1930s, and certainly not a discussion of its importance in analyzing man’s impact on the climate. CliSciFi at its finest.
Figure 3 data source is for that chart that never vanished at all. [It vanished from it’s more prominent, and relevant, position]
I wonder what omissions you are talking about? [Figure 4 is included, but the only reference to it tries to convey the idea that is that it is an indicator of poor land use practices that lead to heat through less water vapor; The omission is that the heat of the 1930’s is a significant and natural occurrence; the lie (not even through omission) is that the 1930’s heat is caused by human actions]
How about a new title: “EPA starts the process of ‘dissapearing’ the 1930’s drought & heatwave data”
As an editor, you could just step up and do that (right?).
Some half a century ago, I would be told that I had to clean my room before I could have friends over. I would accomplish that by sweeping all the inconvenient Legos and dust bunnies under the dresser.
My ten year old friends believed that I had cleaned it. Somehow, the adults in the house knew better.
Maybe it’s time for you and the other climatistas to grow up a bit? We adults know what you did.
Figure 3 should be Figure 1. Any government agency that emphasizes the period from 1960 on has an agenda. And we all know what that agenda is. Nick how can you in good conscience still be defending the alarmists and their fairy tale especially considering the mountain of evidence that CO2 is not correlated to warming?
“Figure 3 should be Figure 1.”
As usual, the figures are numbered in the order they are referred to in the text.
Then the text should have referred to Fig 3 first and stated that there is no cause for concern.
Well, Captain Obvious, as usual you are willfully overlooking the point. Alan was pointing out that the most important should be placed first, which is good journalism.
Yes, one would normally go from the general to the specific. That is, layout the overview, and then perhaps focus on details.
But, it is typical of Stokes to find excuses to defend the alarmist view, even when it is at least poor writing, if not a somewhat subtle attempt to put a spin on the story.
Oh, come on Nick, you’re an intelligent chap. Don’t pretend you don’t know the reason why they shuffled the embarrassing graph lower down the page. It’s a naked attempt to hide the data they don’t want people to see straight away when they visit the website.
I’d love to read their wheedling excuse for shifting the order of the graphs around.
It’s not just that they shifted the graphs around, now (only) the reference to figure 4 implies that the 1930’s spike is just as much related to land use as it is to nature.
Not only do they move the representation of the data (the graph) but they refer to it as …
“Poor land use practices and many years of intense drought contributed to these heat waves by depleting soil moisture and reducing the moderating effects of evaporation”
trying to tie it to human activities as well.
https://www.epa.gov/climate-indicators/weather-climate
“Heat Waves. Heat waves are occurring more than they used to in major cities across the United States. Heat waves are occurring three times more often than they did in the 1960s—about six per year compared with two per year. The average heat wave season is 47 days longer, and individual heat waves are lasting longer and becoming more intense.”
“Drought. Average drought conditions across the nation have varied over time. The 1930s and 1950s saw the most widespread droughts, while the last 50 years have generally been wetter than average. Specific trends vary by region, as the West has generally experienced more drought while the Midwest and Northeast have become wetter. A more detailed index developed recently shows that over the period from 2000 through 2020, roughly 20 to 70 percent of the U.S. land area experienced conditions that were at least abnormally dry at any given time. However, this index has not been in use for long enough to compare with historical drought patterns. ”
It takes awhile to disappear information. Of course major cities had more heat waves. 1960s is conveniently a left over from the much more serious 1950s drought. 2021 may help damage their single generation emphasis. Texas just got lots of rain.
My mother-in-law was in the 1930s drought in Oklahoma when the trees lost their leaves.
This is what Hubert Lamb has to say about the droughts in the US in the 1930’s.
“Successive summers between 1932 and 1937 brought repetition of hot, dry winds from over the Rockies which parched both vegetation and soil in the Middle West. Previously the native grasses of the region, when so parched, had produced a rough dried-up mat that protected the soil. Now the crops were killed, and the soil that had been disturbed by the plough just blew away. In 1933 and 1934 the wind blown dust was readily traced to the east coast. On 12 May 1934 the New York Times reported that the cloud of dust coming from the ‘drought-ridden states as far west as Montana, 1500 miles away, filtered the rays of the sun for five hours yesterday’. New York was in a half-light like conditions in an eclipse, and the dust-cloud was thousands of feet high”
HH Lamb Climate History and the Modern World, 2nd Edition, pp309/310
And people claim that there’s no plan by bad actors to promote CC through misinformation and anyone that believes that is either a cynic, poorly informed, or conspiracy theorist.
It has gotten to the point where if the Leftists declare anything a “conspiracy theory” I can be sure it’s pretty close to the target.
In this brave new world of state-sponsored climate catastrophism that old Soviet sardonicism is now quite literally true.
No one should be surprised. This been ging on in Wikipedia for more than a decade. The same sort of people now hold the government.
Wherever progressives seize control, professional integrity is betrayed in favor of power politics.
The EPA is a rogue, extra-constitutional institution which must be abolished, as it threatens the very foundations of our democracy.
The EPA has a problem they have not yet recognized: those of us who love history and reading journals from the past. Will they trace and remove all the details from those living through this era and drought? Will they be able to explain why so many wrote about this, yet this is not reflected in their data?
I have journals of a gardener who lived some 200 years ago. He recorded all sorts of interesting weather information including the maximum temperatures. These empirical observations actually discredit the modern claims of alarmists about the changes in this area.
Thanks to Edward Katz for identifying another source of reliable climate information in novels. They had no need to fabricate but used real situations as settings for their novels.
Could you publish them?
This is a reason (possibly THE PRIMARY reason) to prefer print over electronic reading material. It would be a really neat trick even for the current Big Brother bureaucrats to get into my bookshelf and alter an article in a magazine or journal I have been saving for 40 years.
Unfortunately, they don’t need to. Guess what happens at 451°F?
I must get out my copy of Gilbert White’s ” Natural History of Selborne ” , written in 1789, which describes the observations of a country parson who recorded a lot of natural phenomena in what must have been in the middle of the Little Ice Age.
There could be some interesting observations.
On Gutenberg
Thanks
Ennui,Russian Roulette and Climate Change. The Western countries are boring. Nobody cares about high temperature— at the flick of the switch the air conditioner is on. If it is warm inside the house than outside it must be winter and vice versa. Who cares about the droughts–a twist of the water faucet valve and you have all the water. Who cares about famine– the supermarket is stock with food from all over the world. If it is winter, fruits from the south where it is summer are always available.It is boring and people could get mentally sick and even die of boredom. How nice to hear the complaints and cursing when gas was not available from the same people who wanted fossil fuel banned.Did any of the group for banning fossil fuel came outside and demonstrate that the unavailability should be made permanent. XR? That was a nice break from boredom. To break the boredom, people play Russian roulette. But it is boring doing it alone. The need to bring along as much as possible in their insanity. So it is called climate change.
Joseph Goebbels nailed it over 70 years ago when he stated:
“If you tell a lie big enough and keep repeating it, people will eventually come to believe it. The lie can be maintained only for such time as the State can shield the people from the political, economic and/or military consequences of the lie. It thus becomes vitally important for the State to use all of its powers to repress dissent, for the truth is the mortal enemy of the lie, and thus by extension, the truth is the greatest enemy of the State.”
Sounds like something Herr Goebbels might have said. Can you cite a source? (The EPA aren’t the only purveyors of disinformation.)
Juan, you post on WUWT and yet don’t have the ability to do Web searches by yourself?
I do think you may have mistaken me for a lap dog.
Note that I never claimed that what Goebbels is credited (by others) with saying is a verbatim quote.
Hi Gordon,
Can you say “rhetorical question”?
Any number of sites call attention to the questionable authenticity of this quote. Here’s a partial comment from history.stack.exchange.com:
...we have read a wide range of Goebbels’s writings and speeches without finding the quotation. (1) No one who cites it online or in available printed sources–including academic works–provides a source.
Lap dog? No, I am happy to see you as an attack dog. And where the EPA is concerned, you don’t need Goebbels to sic ’em. : > )
Juan, are you trying to “prove a negative”? Or just “missing the forest for the trees”?
It is a fake quote. Only English language versions can be found.
Apparently there are now translations back into German, but no original source. Details here.
Oh well, let’s go for a quote from Hitler’s Mein Kampf instead. It appears the Nazis were very much on board with the Big Lie:
“…the big lie there is always a certain force of credibility; because the broad masses of a nation are always more easily corrupted in the deeper strata of their emotional nature than consciously or voluntarily; and thus in the primitive simplicity of their minds they more readily fall victims to the big lie than the small lie, since they themselves often tell small lies in little matters but would be ashamed to resort to large-scale falsehoods”
Ironically, the quote proves itself true regardless of who said it. If you claim Joseph Goebbels said something often enough, people will come to believe he said it.
That seems to be what several “States” have been doing with a certain plandemic code-name repeated several times per minute.
Wasn’t he describing the USSR, or specifically Stalin?
As usual, the left-wingers are guilty of that of which they suspect others. The source of their fears about the Trump Administration deleting climate data was “projection,” rather than evidence.
The graph is plainly visible on the “Climate Change Indicators: Heat Waves” page. Being that it’s a graph showing heat waves, this seems like a natural fit.
Yes. Here is the row of icons on that EPA page

Just click on Fig 3 and there it is.
At first I thought that those tiny thumbnails were all that was left of the three figures, because when I clicked on the thumbnails it didn’t take me to the figures. It appeared that nothing at all happened when I clicked. But that wasn’t actually the case.
Actually, someone just had way too much fun with javascript. To find the big versions, you have to click on the desired thumbnail, and then scroll up. Clicking on the thumbnail caused the top part of the web page to change, to show the full-sized version of the figure.
They sure went to a lot of trouble to reduce the usability of that web page!
Yes, it’s a minor javascript imperfection. The frame changes height, moving the thumbnails and making it harder to notice that the new image has appeared in the frame. It should redirect to head of frame. It probably will soon. But Larry Hamlin says
“It appears that we have entered the Soviet Era of “disappearing” charts and data but now under the era of the “Biden climate science purge.””
I don’t think Biden did it. In fact, the EPA seems to have made the thumbnail/frame convention quite widespread, so it doesn’t take long to get used to it. And it does keep the image close to the text.
This is always the problem using Policy based Evidence Manufacturing.
Reality becomes a major sticking point.
As always,when lying,the problem becomes accounting for your lies.
Past records have become a real pain for the Cult of Calamitous Climate,they long lost track of which were “corrected” and which might still be real.
For the rest of us,it gets easier by the day,if these minions of the parasitic overload are producing,be it script,noise or computer output,assume they are lying.
For this is their track record.
“Reality becomes a major sticking point.”
So much “reality” that no-one bothers to check to see that the graph is still there, perfectly visible, on the EPA page.
Reminds me of a definition from my Uni days:
Reality is an optical illusion caused by alcohol deficiency.
Come on Nick, you can’t possibly be defending this BS.
The whole page amounts to complete misdirection from observed reality; an outrageous abuse of science!
They cut the record in half, disappearing the hottest years, then begin the charts at the coldest point (1960).
Their “Key Points” and graphs are an outstanding example of how to lie with statistics.
Without the qualifying words “after 1960” the following statement is a straight-up lie:
Buried at the bottom – the last point – concedes only to a mealy-mouthed account of heat waves in the 1930s.
… and, just in case anyone actually reads the last point, they include
“Poor land use practices and many years of intense drought contributed to these heat waves by depleting soil moisture and reducing the moderating effects of evaporation”
to push the ‘objectively limited’ towards thinking of human causes … even back then.
OK! Mea culpa. I didn’t check. But, that doesn’t mean that there wasn’t malfeasance on the part of the EPA.
The Y axis on the two graphs is not the same: the first is ‘Heat Wave Index’ the second is ‘Percent of land area’. looks like ‘apples and oranges’ to me
The first replacement graph (the second image in this post) is really odd. Pay attention to how the red line (the hot HIGHs) compares to the yellow line (the hot LOWs). Up until 1960 the red line was slightly above the yellow, and from 1960 to 2000 they basically match each other. But starting in 2000 the yellow line jumps WAY above the red line. That is bizarre. What could possibly explain that? Why would the lows suddenly diverge from the highs?
If it wasn’t for the yellow line there wouldn’t be anything scary about the chart.
Could this be the Urban Heat Island effect manifesting itself? It is known that the UHI tends to warm nights more than days.
That’s what I first thought, but the shift after 2000 is so sudden and dramatic that it can’t be the main reason. Something else is going on, such as a change in how the data is handled or what data is used starting that year.
It’s about Climate Change . So we changed it. So what?
Bureau of Meteorology Australia, reported to the Federal Government 2013/14 for weather data not matching historic records, Dr Jennifer Marohasy and colleagues reported this.
The many “errors and omissions” admitted by BoM to the Minister, and with their undertaking to not allow it to continue, still ignores weather records before 1910 because inclusion lowers their warming trend.
Weather recording stations located in or near to heat sinks another example.
Sorry, but articles like this don’t do the WUWT community any favours, it reads as a kneejerk rant, and it’s main point is wrong.
The EPA’s “climate change indicators” page has obviously been updated and two new sections added.
The “U.S. Annual Heat Wave Index, 1895–2020″ graph has just been moved into the Heatwaves section, which is logical. You can still download the data and the graph.
I do agree however, that there is certainly an argument to be made about the supposed “increase” in heatwaves since the 1960’s, the absolute lowest point on the graph.
In fact all of their dramatic “key points” are relative to the sixties, which is suspicious, and obviously smells of cherries.
The relegation of the 1930’s to basically a localised agricultural footnote of history, when in reality it covered 2/3rds of the USA and also a part of Canada at it’s height, is also a suspicious downplay.
It certainly feels throughout the section on “climate change indicators” that they are trying to make something out of nothing, banging on about heatwaves and drought whilst still having to admit that “Average Drought Conditions Across the Contiguous 48 States According to the SPEI, 1900–2020″ are at their wettest for over a century.
“The relegation of the 1930’s to basically a localised agricultural footnote of history, when in reality it covered 2/3rds of the USA and also a part of Canada at it’s height, is also a suspicious downplay.”
The extreme heat of the decade of the 1930’s was worldwide, not just in the United States.
“We’re sorry, but this video is not available.”
https://www.pbs.org/video/dust-bowl-woody-guthrie-great-dust-storm/
EPA “Disappears” the 1930s Drought and Heat Wave Climate Data.
Library of Congress Purges Steinbeck’s “The Grapes of Wrath”.
https://wattsupwiththat.com/2021/05/19/ban-all-new-gas-boilers-by-2025-say-iea/#comment-3249778
Comrades Biden and Trudeau know best. Big Brother! Big Brother!
It wouldn’t be that they purged Steinbeck … they would just move it to Science Fiction, or Fantasy.
Memo to president DeSantis. Find bloke who did/authorised this fraud, lock him up for treason and throw away the key.
It will soon be time to appoint Dr. Trofim Lysenko to head the EPA and establish re-education camps for those of us who have not accepted the complete and true doctrine of AGW. After that, with the right level of government cooperation, dissenters will be treated much harsher. Never mind the famine (the unintended negative consequences of Lysenkoism whose corollary in my view, is AGW policy).
Considering the current article (above) exposing government data manipulation to favor an unsettled scientific “conclusion”, the energy Industry AGW civil suits, the political and media character assassination of AGW dissenters (Dr Soon, Dr Curry, Dr Koonin et al) it appears to me, we are following a similar path today that Lysenko (and Lysenkoism) followed in the 1930s. Have we learned nothing from history? It is true that dissenting Soviet scientists sent to re-education camps were victims, but in a larger sense, the Soviet people who starved to death by the millions were the real victims of a society unable to effectively manage government policy driven by a highly unsettled scientific claim.
Today’s radial socialists (aka Marxists) are again imposing Lysenkoism in the guise of “Climate Science” – to the great detriment of real Science. Restore the foundations of “Take Nobody’s Word for it” (In nullius verba) per the Royal Society’s motto. Test All Things. Validate/invalidate models based on objective evaluation against real data. See Richard Feynman on the “Scientific Method” https://www.youtube.com/watch?v=EYPapE-3FRw&t=17s
Ironically, it were the high temperatures and droughts of the 1930s that prompted Guy Callendar to promote his theory that rising industrial CO2 in early 20th Century was causing the rising heat. The subsequent cooling after his 1938 paper only temporarily dampened enthusiasm for his hypothesis. Like socialism, notions of a Bermuda triangle, and other bad ideas, anthropogenic global warming has taken on a life of its own.
How many fingers…. Winston?
I completed an analysis of the 30 year average high and low temperatures for all provincial capital cities, Ottawa’s, and the capitals of the thee territories n Canada. While I did find global warming it was at roughly half the rate NASA reported. Furthermore, it has been driven by milder winters and higher daily lows in the rest of the year. The increase in daily high temperatures is minimal. In Canada global warming is benign.
Not benign ….
Beneficial !
Soon white supremacists will be blamed for JFK assassination.