U.S. Climate 2023 Year in Review – In one word: NORMAL

From Dr. Roger Pielke Jr on his website:

The year is not quite in the books, but it is late enough that we can have a look-back at this year’s weather and climate extremes.

We are all well aware of the narrative that the weather is quickly getting worse. Unfortunately, data does not agree.1

The weather — and certainly the impacts — of the past 12 months in the United States was actually pretty typical, even benign, in historical context.2

The one variable that stands out among extreme weather is temperature — extreme high temperatures in summer and (in particular) winter were very high in 2023, both of which contribute to a long-term trend that the IPCC has attributed primarily to the emissions of carbon dioxide from the burning of fossil fuels.

The table below provides the top-line summary.

This year will come in well below average for the total and insured economic costs of disasters in the United States, mainly because the only landfalling hurricane (Idalia) resulted in less than $1 billion in total damages, far less than the $22+ billion of an average hurricane season.

Let’s take a quick, but detailed, look at 2023.

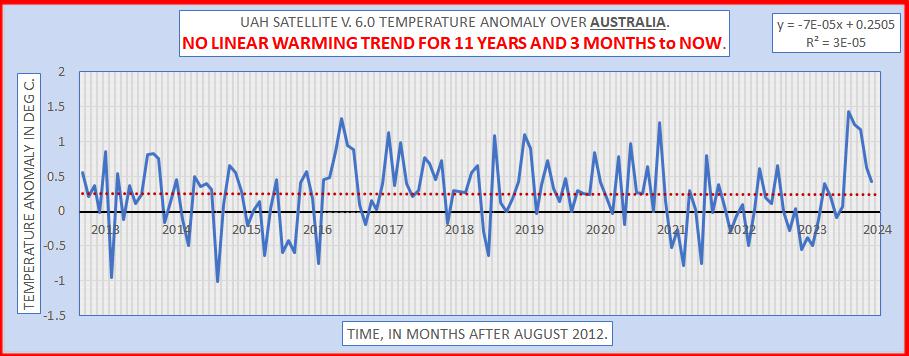
Average Temperature Anomaly

Month-by-month, 2023 ventured above and below the zero-line of the NOAA temperature anomaly time series (the USCRN). You can see from the figure above that there is no trend in this time series since December 2000, which is counter to what has occurred globally.

Extreme Heat and Cold

The figures above for January (top) and July (bottom) show clearly that maximum temperatures have increased since 1895 for both winter and summer, as is expected. July, 2023 was the 13th warmest July since 1895.

Also, take a look at the 1930s for July, the 3 big dips in 1915, 1950 and 1992, and 1976-1977-1978 for January — Brrrr!3

Hurricanes

You can see a full post on the US 2023 hurricane season here. Lots of interesting details, but as far as landfalls and damage, just Hurricane Idalia which was preliminarily classified as a Category 3 storm, but to date just over $300 million in insured damage … Zzzzzz.

Flooding

The US sees a lot of flooding every year. It is normal. This year saw its fair share but nothing unusual or particularly damaging. Disaster declarations don’t tell us anything about climate, but they do tell us something about disaster declarations — 2023 saw (to date) 19 flood-related FEMA disaster declarations, which is just about exactly the average from 2000-2022.4 You can dive much deeper into trends in US flood at this recent post. 2023 will no doubt be consistent with the trends documented there.

Drought

2023 was not particularly exceptional for drought in long-term context. In fact, compared to one year ago, 2023 has seen a markedly improvement in US drought conditions, as you can see below — with December 2022 on the left and December 2023 on the right. 2023 ends the year just about in the 50th percentile of months since 2000 for area under exceptional and extreme drought.

The figure below shows the proportion of US land area characterized as “very wet” and “very dry” from 1895 to 2023. If you squint, you can see that “very dry” has declined a bit, with extremes reduced dramatically since the 1950s, while “very wet” has increased, with more extremes since the 1980s. Fascinating, as Spock would say.

The “very wet” and “very dry” time series has a lot of month-to-month variability — in 2023 the “very wet” area ranged from 0.81% of the country (Nov) to 23.56% (Jan), and “very dry” from 3.36% (Jan) to 23.07% (Jul).

Tornados, Hail, Wind

The figures above show from left to right, tornadoes, hail and wind local storm report counts, based on preliminary data for 2023. The data shows that tornadoes are a bit above the recent average and hail is a bit below. Winds, in contrast, were exceptionally high in 2023. Given that convective storms produce tornadoes, hail and winds, I am looking forward to how meteorologists explain these contrasting trends of 2023. Economic losses from hail and wind were quite large in 2023.

Wildfire

Remarkably, 2023 has seen the fewest acres burned in the US since 1998. Everyone has heard about the record wildfires in Canada, but the quiet US season has been largely ignored.

Thanks for reading! THB is reader supported and reader appreciated. If you value what you read here, please consider supporting the work that goes into it. THB is an experiment in how to do independent research and writing, and the success of that experiment depends upon you — News to come soon on that, thanks to the THB community. Comments, questions, critique are all welcomed. Happy holidays!

Notes:

1 The media’s reluctance to accurately report actual data remains amazing to me.

2 Climate science suffers from the generational loss of empirical climatologists such as Will Kellogg, Stan Changnon, Bill Gray, H.H. Lamb and many others. I am really fortunate to have known and learned from many of them.

3 There is so much interesting research on observed climate variability goes undiscussed due to a monomaniacal focus on projected climate change.

4 Fortune, fame and a nice H-Index await the researchers who can develop a meaningful index of flooding for various spatial scales — including nations and the world — that allows for an intuitive understanding of trends.

5 18 votes
Article Rating
Subscribe
Notify of
62 Comments
Oldest
Newest Most Voted
Inline Feedbacks
View all comments
bnice2000
December 20, 2023 2:09 pm

Could say the same about “down under” (Australia)

A couple of rather warm day recently.. not unusual for December.

A recent big bushfire out in central NSW.. nothing unusual about that.

Big floods on the Queensland north coast…. nothing unusual about that

A slightly less cold winter.

Nothing much out of the “norm” all year, actually.

Only thing a bit unusual is the large amount of rain we are getting on the East Coast during the strong El Nino, which usually leaves the East Coast rather dry.

Geoff Sherrington
Reply to  bnice2000
December 20, 2023 6:40 pm

comment image
Geoff S

bnice2000
Reply to  Geoff Sherrington
December 20, 2023 6:47 pm

not found ? !

Geoff Sherrington
Reply to  Geoff Sherrington
December 20, 2023 8:02 pm

Typing wrong, only one eye after an eye operation. Geoff S
comment image

Joseph Zorzin
Reply to  Geoff Sherrington
December 21, 2023 2:40 am

no “emergency” or “crisis” evident- so you can ignore Greta and not panic 🙂

rah
Reply to  Geoff Sherrington
December 21, 2023 3:47 am

I assume you’ll be getting the vision back in that eye?

Gunga Din
Reply to  Geoff Sherrington
December 22, 2023 3:01 pm

Prayers.

altipueri
December 20, 2023 2:18 pm

Has WUWT joined the dark side?

How do I get rid of all this WordPress stuff spamming my email now I made the mistake of subscribing?

.

Joseph Zorzin
Reply to  altipueri
December 21, 2023 2:41 am

how do you know it’s WordPress stuff?

Gunga Din
Reply to  altipueri
December 22, 2023 3:10 pm

I don’t have a cell phone. Only a desktop.
But do you have any type of security “apps” running?
If not, install some. Ad blockers are good too. Most will let you exclude sites to be blocked, such as WUWT.

Gunga Din
Reply to  Gunga Din
December 22, 2023 3:12 pm

And remember that this site is always under cyber attacks.
WUWT does a great job on their end.
Do something on your end.

Rud Istvan
December 20, 2023 2:41 pm

I would revise the title: “US WEATHER 2023 normal. At anything less than 30 years (by definition) climate is what you expect but weather is what you get. Otherwise, a good YE review.

Notice what was spun versus what happened. NHC predicted an above average active Atlantic hurricane season; didn’t happen. California predicted another above average fire season; didn’t happen. Kerry said COP28 success was essential; didn’t happen. UN SecGen Guttiere said oceans were boiling; didn’t happen.
And in the bigger picture, Biden got his ‘Inflation Reduction Act’; that didn’t happen. Harris was appointed border czar to solve the illegal immigrant tsunami; that didn’t happen. Mayor of NYC (ex senior cop) elected to solve crime; that didn’t happen.

John Oliver
Reply to  Rud Istvan
December 20, 2023 3:06 pm

We have a dysfunctional society in every way. The MSM, Main stream scientific community, and of course our political systems. None of the many issues that routinely face a nation and its people can be delt with if we do not have a functioning constitutional republic with the people choosing the candidate they want and integrity in the election process . I am very uneasy as of late, got a bad feeling.

All other issues pale and shrink to insignificance now.We are heading for a terrible show down/ event-

scvblwxq
Reply to  John Oliver
December 21, 2023 11:39 am

The institutions you mention are pretty much controlled by the wealthy.

scvblwxq
Reply to  Rud Istvan
December 21, 2023 11:37 am

I guess they redefined “climate” to be only 30 years now so it is always changing.

Nick Stokes
December 20, 2023 2:43 pm

None of the figures sshow in my browser.

Sunsettommy
Reply to  Nick Stokes
December 20, 2023 2:52 pm

You forgot to install the reality filter into the browser.

Krishna Gans
Reply to  Nick Stokes
December 20, 2023 3:00 pm

This time you are right, have the problem with Firefox.

Curious George
Reply to  Krishna Gans
December 20, 2023 4:10 pm

Same problem with Chrome and Microsoft Edge.

Nick Stokes
Reply to  Nick Stokes
December 20, 2023 3:06 pm

The first three have now appeared. Maybe they just take a very long time to render.

gdt
Reply to  Nick Stokes
December 20, 2023 3:20 pm

Just click the link to Roger’s original article

John Hultquist
Reply to  Nick Stokes
December 20, 2023 8:30 pm

I’m on a DSL connection using MS Edge. No problems.
Maybe the images loaded while I was reading the intro.
One more of life’s little puzzles.

David Kamakaris
December 20, 2023 3:03 pm

“U.S. Climate 2023 Year in Review – In one word: NORMAL”

But is it the new normal or the old normal?

ToldYouSo
Reply to  David Kamakaris
December 20, 2023 3:42 pm

That’s a question best suited for an AI bot to answer . . . you know, because they “obviously” don’t have any bias.

/sarc

ToldYouSo
December 20, 2023 3:37 pm

U.S. Climate 2023:
— normal, or
— Existential Threat, or
— Catastrophic Climate Change, or
— Tipping Point, or
— Boiling Oceans, or
— Hottest Year Ever.

You decide based on objective evidence . . . but don’t take too long or yet another year will have passed.

Curious George
Reply to  ToldYouSo
December 20, 2023 4:17 pm

All of the above, depending on your climate religion.

Nick Stokes
December 20, 2023 4:27 pm

You can see from the figure above that there is no trend in this time series since December 2000″

Often said at WUWT, but just wrong, and Pielke should know better. If you see that, your eyes are deceiving you. There is a positive trend of 2.296 ± 0.978 °C/Century, which is actually higher than the global trend.

Of course, that is ClimDiv, not USCRN, which only goes from 2006. But the trend of USCRN is higher.

bnice2000
Reply to  Nick Stokes
December 20, 2023 4:49 pm

Look at the range of values, USA USCN has a range of about 10ºC

Global UAH has a range of about 1.2ºC

A person with any understanding of basic mathematics would know it is meaningless to compare trends in highly averaged data (UAH global) with more localised data.

Nick Stokes
Reply to  bnice2000
December 20, 2023 7:50 pm

A person with any understanding of basic mathematics would know it is meaningless to compare trends in highly averaged data (UAH global) with more localised data.”

It was Pielke who did that, saying:
 You can see from the figure above that there is no trend in this time series since December 2000, which is counter to what has occurred globally.

I just point out that the US trend is higher than what has occurred globally.

bnice2000
Reply to  Nick Stokes
December 20, 2023 8:19 pm

Yawn.

You still can’t accept or UNDERSTAND your basic mathematical FALLACY can you! !!

bnice2000
Reply to  Nick Stokes
December 20, 2023 8:41 pm

Do you DENY that the “calculated” linear trend come purely from the position of the 2015/16 El Nino bulge.?

Do you DENY that there is NO EVIDENCE of any human causation in the very slight monkey-calculated linear trend. ??

bnice2000
Reply to  Nick Stokes
December 20, 2023 4:54 pm

And of course, the trend in USCRN come mainly from the bulge through the 2015/16 El Nino.

Temperatures over the last year or 2 years have been similar to the zero trend value before the El Nino.

ToldYouSo
Reply to  Nick Stokes
December 21, 2023 8:20 am

Hmmm . . . Nick Stokes at it again . . . lecturing others while being oblivious to his foolishness in posting a warming trend stated to a precision of one millidegree Centigrade while at the same time stating an uncertainty of nearly ± 1 °C.

Nick Stokes
Reply to  ToldYouSo
December 21, 2023 12:36 pm

When I do a calculation, I report the results. You can do whatever rounding ou prefer. You can’t unround.

Tim Gorman
Reply to  Nick Stokes
December 21, 2023 2:20 pm

Stated values should never have more significant digits or more decimal places than the uncertainty. If the uncertainty is +/- 1C then the trend should not be based on any values less than the units digit.

Do that and you won’t find a trend, the line will be horizontal!

Nick Stokes
Reply to  Tim Gorman
December 21, 2023 7:23 pm

Do that and you won’t find a trend”

which I guess is what you want. But there is one.

Jim Gorman
Reply to  Nick Stokes
December 22, 2023 6:17 am

No, there isn’t a significant scientific trend. It is like saying I averaged all four brake calipers, each measured to the one-thousands of an inch, but the average is to the one-ten-thousandths of an inch and shows none of them need to be replaced. STATISTICS SAY SO!

Would you drive a car if your mechanic did that? Would you fly a plane engineered and built that way?

ToldYouSo
Reply to  Nick Stokes
December 21, 2023 4:03 pm

“When I do a calculation, I report the results. You can do whatever rounding (y)ou prefer.”

Well, why then did you stop at just 3 places to the right of the decimal point. Many calculators and most home computers output 8 to 12 digits . . . you only gave 4 (for each value) for your “results”.

Now I feel cheated because I can’t round off your values to, say, 7 digits to determine “what’s really going on” . . . DARN! And, as you pointed out, I can’t undue your rounding.

ROTFLOL.

rah
Reply to  Nick Stokes
December 21, 2023 8:31 am

Not that I agree but the way I see it is the question is SO WHAT! Nothing, not a single predicted disaster has occurred. They can fiddle with the temperature data to try and make it correspond to the increase in atmospheric CO2 all they want! The bottom line is that nothing unusual is resulting from it. Nothing that in the weather is effecting the quality of life of the average person while the supposed policy measures to mitigate rising CO2 and temperature ARE having a negative effect on the quality of life of millions of US citizens. And THAT is the real bottom line!

scvblwxq
Reply to  rah
December 21, 2023 11:29 am

Bloomberg’s green-energy research team estimated it would cost $US200 Trillion to stop Global Warming by 2050. 

There is only $US40 trillion in cash, checking, and savings worldwide.

There are about 2 billion households worldwide, which is $US100,000 per household. 

Ninety percent of the world’s households can’t afford anything additional so the households in developed nations will have to pay 10 times as much to cover it.

That means about $US 1 million per household in developed countries or about $US 35,000 per year for 27 years.

The working families can’t afford anything near that, most would prefer to have $US1 million in the bank and a degree or two of warming, if that even occurs. 

Jim Gorman
Reply to  Nick Stokes
December 22, 2023 6:09 am

Splicing one temperature data onto the end of another is not scientific. There is no calibration curve to allow for the corrections. It is basically what “hide the decline” was all about these many moons ago. Either use CiimDev entirely or CRN entirely but mixing them as NOAA has done is misleading as hell.

TheFinalNail
December 20, 2023 5:00 pm

Month-by-month, 2023 ventured above and below the zero-line of the NOAA temperature anomaly time series (the USCRN). You can see from the figure above that there is no trend in this time series since December 2000…

USCRN only begins in 2005, so how can it be used to determine a trend from 2000? The trend in USCRN since it began in 2005 is +0.56F per decade warming. The trend in ClimDiv, which can be determined from 2000, is +0.34F per decade warming.

Over their joint period of measurement, Jan 2005 to Nov 2023, the warming trend in USCRN is faster than that in ClimDiv (+0.56F per decade in USCRN vrs +0.43F per decade in ClimDiv.

Either way, the claim that ‘there is no trend in [the US temperature] time series since 2000’ is patently false, even using the data presented here.

bnice2000
Reply to  TheFinalNail
December 20, 2023 5:16 pm

Your ignorance is showing .. as always. Monkey with ruler but no comprehension.

There is no significant difference between the different USA trends.

The trend in USCRN comes from the 2015/16 El Nino bulge.

That has now gone, and temperature are back down to what they were before the El Nino.

USA trends..png
bnice2000
Reply to  bnice2000
December 20, 2023 5:17 pm

Note. values are in Celcius in that chart.

bnice2000
Reply to  TheFinalNail
December 20, 2023 5:23 pm

btw…. have you figured out how much warmer it must have been 1000 or so years ago, for forests to have grown where there are now glaciers ?

… or why tree lines were much higher up mountains, and much further north only 1000 or so years ago

Also, have you got any evidence of human causation for the El Nino events that are the ONLY atmospheric warming in the last 45 years ??

We are still waiting. !

Jim Gorman
Reply to  TheFinalNail
December 22, 2023 6:41 am

Do you ever do research. The blue portion of that graph is from cliimdev data. The red porrion is from the CRN. BTW, the CRN began in 2001 and took several years to finish installation of all the stations. Research Highlight: NOAA’s U.S. Climate Reference Network (CRN) Fully Deployed – August, 2008 – Air Resources Laboratory

National Temperature Index | National Centers for Environmental Information (NCEI) (noaa.gov)

Peta of Newark
December 20, 2023 5:54 pm

This relentless use of averages is normalising your own extinction – you throwing away all the relevant data.

I went to a randomly chosen Wunderground station near Steelville Missouri and scanned through the monthly data graphs for 2023

1/ The daily temperature excursions were about the maximum you could get considering the thermal inertia of dry land
i.e. about 20 Celsius
For ‘wet’ places, consider well less than half that

2/ The average barometric pressure across whole months never went below 1015
That means you were under a cyclonic (high pressure) ridge which means relentless drying conditions with temperatures determined by katabatic heating
That is Very Bad News because those weather systems are self-reinforcing – the drying begets ever more drying, it begets ever hotter summers and ever colder winters and puts ever greater stress on CO₂ absorbers such as ‘plants’

3/ Rainfall typically occurred as huge thunderstorms, spaced 10, 12 and 15 days apart and dropping one or two inches of water inside 30 minutes
That sort of rain does immense damage to plants on the ground, to the ground itself especially if the plants are suffering and the soil is very dry

Consider: You are = A Plant. You need water every day or you are really struggling, heading into dormancy or completely died/dead.
i.e. You will not be photosynthesising at the rate you otherwise would (see why atmospheric CO₂ is rising, nobody is absorbing the stuff.)
Magical Thinking and confirmation bias tell you firmly not to consider yourself = a plant…

…….so consider yourself a normal sort of human in a lonely and dry place such as Central Missouri,
All you need is 4 pints water per day to survive and have no way of storing water.
You could last 6 weeks at that without food.

If someone comes along once every 2 weeks and throws a bucket of water containing 56 pints of water over you in a ‘shower’ lasting that many seconds – will you be OK?
Will that enable you to survive and do strenuous hard work – such as ‘making babies’ as an adult or even just putting on weight if you were a juvenile/child/baby?

Because The Average says that you got your 4 pints per day.
Therefore: Everything is OK if not = Never better.
But with no storage facility, as plants have in eroded soils, will 56 pints delivered in 2 hour long blasts a fortnight apart be OK for you?

JCM
Reply to  Peta of Newark
December 20, 2023 6:31 pm

yes spot on

JCM
Reply to  Peta of Newark
December 20, 2023 8:25 pm

more on that:

climatists genuinely perceive themselves as Earthly stewards –

However! whether viewed in a classic or modern context, climatology is exclusively involving the logging of averages related to weather over multi decadal timeframes.

It’s not dealing with the specific local circumstances experienced in real time i.e. what is felt in actuality by a living breathing organism during their life. The stuff of life or death – by definition: sub climate scale stuff.

That is – the climate cannot be watched from the window, felt in the tongue, or sensed on the skin. In this regard, climatists are unable to provide insights.

On that: the things which can be sensed ((empiricism)); this is what characterizes reality in the most common way. The average of anomalies in watts per square meter across geographies or multidecadal rainfalls is anything but that! Climate is experienced only in a spreadsheet program or integral math equation.

and so – climatists must withdraw from their delusions about environmental awareness and knowledge. What they are offering is not stewardship in the usual way. What they offer is by definition virtual and rationalized.

What does the climate mean to a rabbit, a potato, or a worm? nothing, really. What is real to them is the soil, a stream, and the bushes. That’s it. To help them protect those things first and foremost. It’s really that simple.

Richard Page
Reply to  JCM
December 21, 2023 1:24 am

Politicised ecology not ‘climate science’.

Tim Gorman
Reply to  JCM
December 21, 2023 5:58 am

The prime example of this is combining average winter temps from one hemisphere with average summer temps in the other hemisphere in order to create a “global” average.

The winter and summer temps have different variances and simply can’t be combined using an “average” while ignoring the different variances. Yet climate science insists on doing that very thing – just like they insist on ignoring the impact of measurement uncertainty in trying to determine a “global average” out to the hundredths or thousandths digit.

Bob
December 20, 2023 6:47 pm

Nice report.

Joseph Zorzin
December 21, 2023 2:31 am

“The one variable that stands out among extreme weather is temperature — extreme high temperatures….”

Was it necessary to say “extreme”?

Matthew Bergin
Reply to  Joseph Zorzin
December 21, 2023 6:47 am

Here in Ontario I don’t remember any abnormally high temperatures this summer. My unheated pool never made it to 80° this year and it usually hits that temp early in the summer.

Joseph Zorzin
December 21, 2023 2:38 am

“Fortune, fame and a nice H-Index await the researchers who can develop a meaningful index of flooding for various spatial scales — including nations and the world — that allows for an intuitive understanding of trends.”

Don’t geologists have a grip on that? They should be the experts. They’ve got all the rocks of the planet to study – many showing flooding which built those rock formations. And they have dating techniques. I would think (no claim to being any kind of scientist) that such work would be more fruitful than merely studying the past few centuries’ flooding.

I have no idea what an H-Index is. Not sure getting an “intuitive understand of trends” is as valuable as a multi million year study of rock formations.

I only wish I had become a geologist- I developed a love of that science only in recent years after several long trips to the American west. The scenery is fantastic. And your appreciation of that scenery only gets better if you understand how it formed over vast periods of time.

rah
December 21, 2023 3:46 am

Actually the Tornado count this year is well below average. Comes in at just above the 25th percentile.

comment image

John Oliver
December 21, 2023 5:45 am

Either way- still one thin page out of an encyclopedic ( old school printed) size paleoclimatic record of questionable accuracy and precision .

John Oliver
December 21, 2023 5:56 am

And just about time to make guesses and wagers on what will be the state and condition of your ( once?) great nation: climate trend ( interpreted) green energy trend effective( interpreted ) , national ethical moral trend ( interpreted), decline of western civilization..

John Oliver
Reply to  John Oliver
December 21, 2023 5:56 am

1 year from now.

rah
December 21, 2023 4:27 pm
John Hultquist
Reply to  rah
December 21, 2023 9:12 pm

 “The Earth resembles Venus” – – – Again!

Frederick Michael
December 22, 2023 8:24 am

I think the 2023 hurricane landfalls may be overstated here. Idalia’s windspeed dropped sharply just before it made landfall due to eyewall replacement. The official NOAA database shows no US hurricane landfalls in 2023.

https://www.aoml.noaa.gov/hrd/hurdat/All_U.S._Hurricanes.html

%d
Verified by MonsterInsights